Energy Management and CO₂ Emission Reduction
Monitoring and management of electricity consumption in the buildings of the National Technical University of Athens (Zografou & Patision)

The complex of buildings of the Polytechnic University of Zografou comprises installations of an area of 262,000 m², which are scattered over about 1,000 acres. The existing electricity supply network consists of installed low and medium voltage fields in which there are analogous voltage and current measuring instruments.
The measured quantities refer to phase voltage and current, active and inert power per phase, total energy as well as total power factor.
In addition to the Zografou Polytechnic complex, electricity meters have also been installed in the Patission complex in the Tositsa, Averoff and Mpoumpoulina buildings with a total area of 26,000 m².
In total, 70 energy meters are installed in the buildings of the two complexes. Data from the meters (kW, kWh, A, V, PF etc.) are collected at regular intervals (15′) and stored in databases.
In particular, to monitor energy consumption for heating, cooling and lighting, the following have been installed:
- 70 electricity meters
- 58 Power Converters
- 23 analog to digital converters
- 2 PLC
While to monitor the thermal comfort of a typical -pilot- office have been installed
- 4 temperature sensors
- 4 lux meters
- 4 Relative Humidity Sensors
To assess the comfort conditions in workplaces, four temperature/humidity measuring devices were installed. in the reception area of the secretariat of the School of Mechanical Engineering The temperature sensor is PT100 type with a measurement range of -20 to 100 °C. The humidity sensor takes measurements of absolute humidity, dry and wet bulb temperature, with a measurement range of 0 – 100%RH, accuracy ±1.5%RH and 0.1% RH instrument resolution.
The network of meters and controllers is given by the following figure:
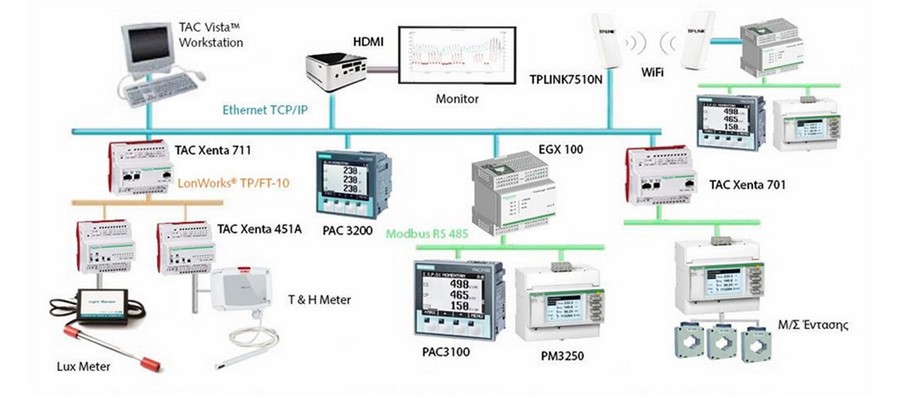
Fig. 8. Topology of the Consumption and Comfort Recording System
The display of consumption on buildings in real time, is conducted via a screen placed in the Library of the National Technical University of Athens (Fig. 9). The screen displays the data collected by the automatic data collection system and informs users/visitors in real time about the consumption in the entire complex.
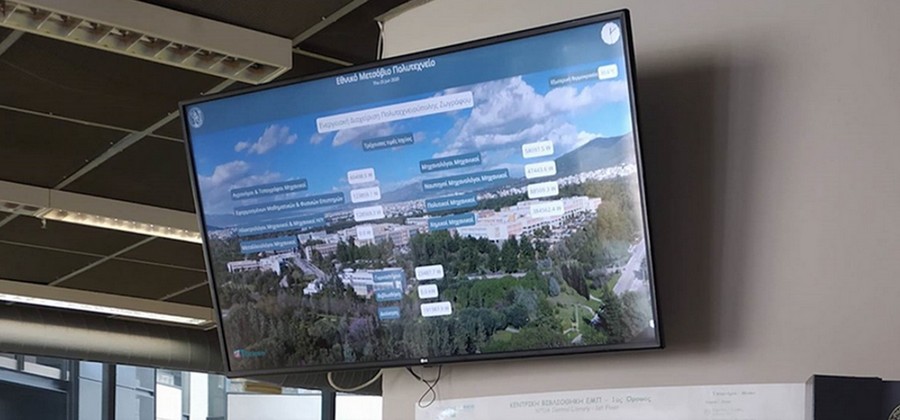
Fig. 9. The display screen of the consumption of buildings in the library of the National Technical University of Athens
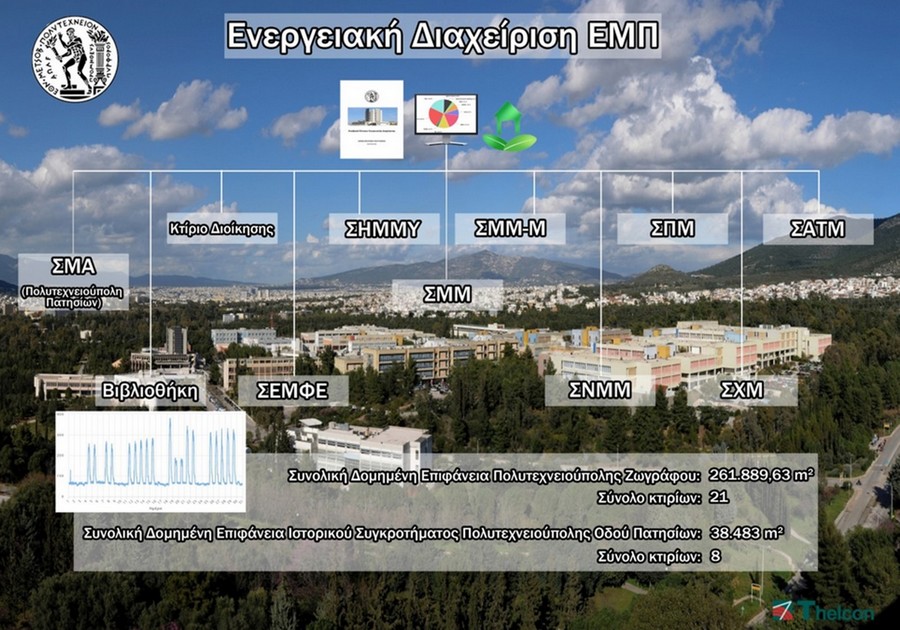
Fig. 10. Illustration of all energy records of NTUA
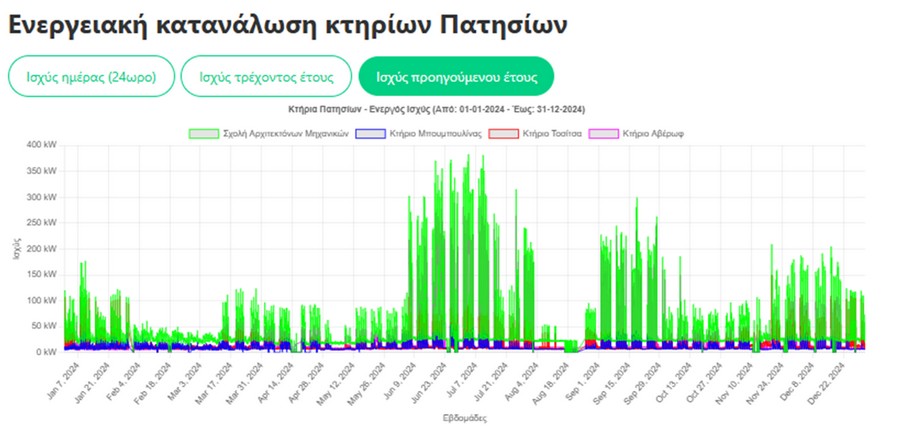
Fig. 11 indicatively presents the annual consumption of 2024 for the Administration Building, the School of Architecture and Electrical and Computer Engineering.
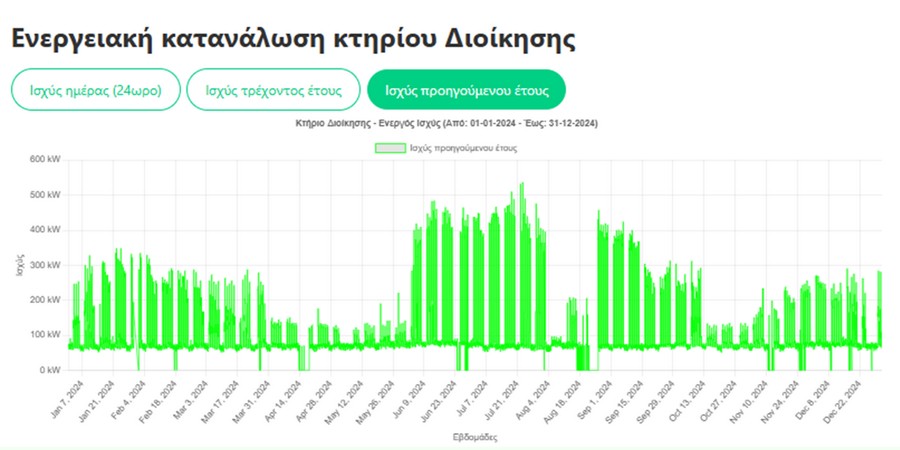
(α)
(β)
(γ)
Fig. 11. Annual consumption of 2024 (a) for the Administration Building of the National Technical University of Athens (b) the School of Architecture and (c) the School of Electrical and Computer Engineering
An integral part of the information and communication of NTUA’s goals and achievements of on issues related to sustainable development and sustainability is the systematic recording and promotion of the progress made in an accurate and transparent manner. NTUA systematically publishes numerous relevant reports on sustainable development and sustainability in its premises, the measurement and recording of greenhouse gas (GHG) emissions, building certifications, etc. In addition, NTUA participates in national and international sustainable development programs.